Visualizing Internal Variables Printed From The User Element Subroutine
This notebook presents the steps to use the czmtestkit package to read and visualize internal variables from the user element subroutine printed to the .msg file while running the simulation. Inorder to use this functionality of the package, print the variable Var of interest to the .msg file using the following command in the fortran code of the subroutine:
WRITE(7,*) 'VarKey = ', Var
Run ADCB_UEL.ipynb to generate sample files. Read the .msg file and find the line numbers in the .msg file corresponding to the stable increments using czmtestkit.py_modules.find_convergedIncrements.
[6]:
from czmtestkit.py_modules import find_convergedIncrements
File= 'ADCB_UEL\point_05\ADCB_UEL.msg'
converged_time,  last_unconv_it, converged_it = find_convergedIncrements(File)
print('Last line numbers from converged increments:', '\n',converged_it, '\n')
print('Last line numbers from the last increment before converged increments:', '\n', last_unconv_it, '\n')
print('Step times of converged increments:', '\n',converged_time, '\n')
Last line numbers from converged increments:
 [13275, 19849, 25333, 32927, 43743, 75658, 95899, 103400, 122627, 191886, 213140, 224839, 865040, 1506327, 1537206, 1545720, 1547865, 1555295, 1557440]

Last line numbers from the last increment before converged increments:
 [12147, 18734, 24207, 31801, 40518, 74557, 94799, 102300, 121527, 188687, 212040, 223739, 862883, 1505226, 1534007, 1544620, 1544620, 1552094, 1552094]

Step times of converged increments:
 ['0.100', '0.200', '0.300', '0.400', '0.500', '0.600', '0.700', '0.800', '0.900', '0.925', '0.950', '0.975', '0.981', '0.984', '0.987', '0.991', '0.994', '0.999', '1.00']
Initialize an increment class instance for every stable increment and assign the limiting line numbers corresponding to the increment. Line number corresponding to the last line from the increment before a converged increment is the start of the increment and the line number corresponding to the last of converged increment is the end of the increment.
Then, for each stable increment, find the line numbers where the variable Var is printed using the key word VarKey and the find_lineNumbers method.
increment.findlineNumbers('VarKey', p, (m,n))
where p is the number of lines for each entry of the variable Var and m,n are the number of rows and columns. For example, the variable Var is printed to the .msg file as
VarKey = 1.000000 2.000000 3.000000
 4.000000 5.000000 6.000000
Since the entry extends to two lines the p is 2. Further, if the variable Var has two rows and three columns with m = 2 and n = 3.
find_lineNumbers method creates an instance of the data class and stores the corresponding line numbers as instance attributes each time the Var is printed within the limits of the stable increment. A list of all the data class instances created is stored as an attribute of the increment class instance.
Further, find_data method fetches the data between the line numbers fetched by find_lineNumbers method and converts it to matrix of the shape m,n for all the data class instances in the list. For example above entry is converted to
The matix is assigned to the value attribute of the corresponding data class instance. Finally, find_data creates data attribute for the increment class instance which is a dictionary with the VarKey as keys and the lists of corresponding data class instances as values.
[2]:
from czmtestkit.py_modules import increment
entries = []
for j in range(len(converged_it)):
    ent = increment()
    ent.fileName = File
    ent.step_time = converged_time[j]
    ent.start = last_unconv_it[j]
    ent.stop = converged_it[j]
    entries.append(ent)
    ent.find_lineNumbers('IP',1,(2,1))
    ent.find_lineNumbers('GIP',1,(3,1))
    ent.find_lineNumbers('TAU',1,(3,1))
    ent.find_lineNumbers('DTAU',3,(3,3))
    ent.find_lineNumbers('DG',24,(3,24))
    ent.find_lineNumbers('DR',24,(3,24))
    ent.find_data()
Finally, edit the setup_frame and frame_plot methods of the frame_iterator class to present variables of interest as colormaps and create a movie of frames from all the stable increments. Use the setup_frame method to setup the plot area, titles, and axes, and frame_plot method to plot the increments.
Note: Do not change the input parameters of the setup_frame and frame_plot methods.
[3]:
import numpy as np
from IPython import display
from matplotlib import pyplot as plt
from matplotlib import animation as animation
%matplotlib inline
class frame_iterator:
def __init__(self, array, fileName):
self.mainArray = array
self.itr = len(array)
self.name = fileName
def animate(self): # Animator
self.setup_frame()
Writer = animation.FFMpegWriter
writer = Writer(fps=1, metadata=dict(artist='Nanditha Mudunuru'), bitrate=1800)
anim = animation.FuncAnimation(self.fig, self.frame_plot, frames=self.itr, blit=False, repeat=True)
anim.save(self.name+'.mp4', writer=writer)
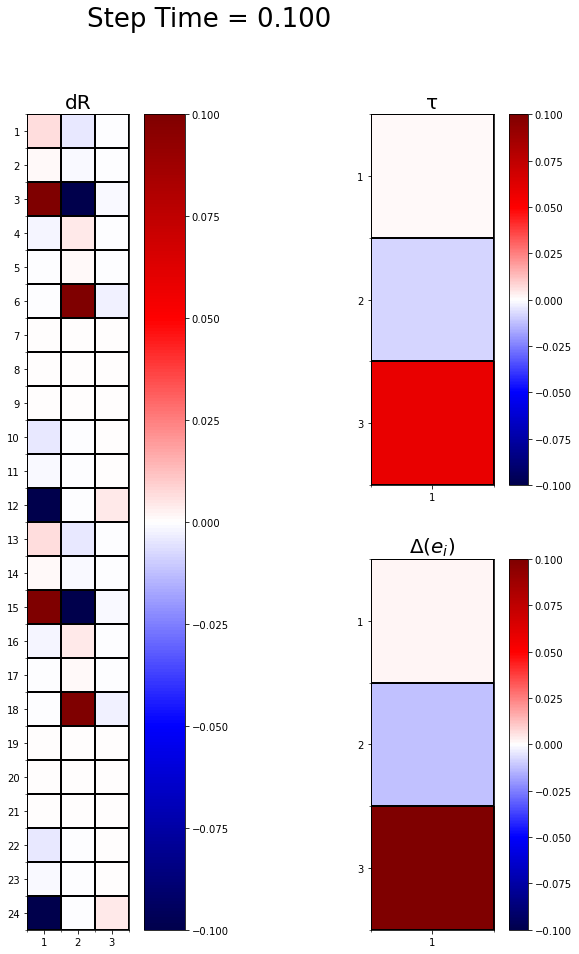
def setup_frame(self): # Main frame
fig = plt.figure(figsize=(12,15))
self.fig = fig
# dR color map
ax1 = fig.add_subplot(121)
self.ax1 = ax1
ax1.set_title('dR', fontsize=20)
self.im1 = ax1.imshow(np.zeros([24,3]), cmap='seismic')
self.fig.colorbar(self.im1, ax=self.ax1, orientation='vertical')
# Major ticks and labels
ax1.set_yticks(np.arange(0, 24, 1))
ax1.set_xticks(np.arange(0, 3, 1))
ax1.set_yticklabels(np.arange(1, 25, 1))
ax1.set_xticklabels(np.arange(1, 4, 1))
# Minor ticks and grid
ax1.set_yticks(np.arange(-.5, 24, 1), minor=True)
ax1.set_xticks(np.arange(-.5, 3, 1), minor=True)
ax1.grid(which='minor', color='black', linewidth=2)
# tau color map
ax2 = fig.add_subplot(222)
self.ax2 = ax2
ax2.set_title('\u03C4', fontsize=20)
self.im2 = ax2.imshow(np.zeros([3,1]), cmap='seismic')
self.fig.colorbar(self.im2, ax=self.ax2, orientation='vertical')
# Major ticks and labels
ax2.set_xticks(np.arange(0, 1, 1))
ax2.set_yticks(np.arange(0, 3, 1))
ax2.set_xticklabels(np.arange(1, 2, 1))
ax2.set_yticklabels(np.arange(1, 4, 1))
# Minor ticks and grid
ax2.set_xticks(np.arange(-.5, 1, 1), minor=True)
ax2.set_yticks(np.arange(-.5, 3, 1), minor=True)
ax2.grid(which='minor', color='black', linewidth=2)
# GIP color map
ax3 = fig.add_subplot(224)
self.ax3 = ax3
ax3.set_title(r'$\Delta(e_i)$', fontsize=20)
self.im3 = ax3.imshow(np.zeros([3,1]), cmap='seismic')
self.fig.colorbar(self.im3, ax=self.ax3, orientation='vertical')
# Major ticks and labels
ax3.set_xticks(np.arange(0, 1, 1))
ax3.set_yticks(np.arange(0, 3, 1))
ax3.set_xticklabels(np.arange(1, 2, 1))
ax3.set_yticklabels(np.arange(1, 4, 1))
# Minor ticks and grid
ax3.set_xticks(np.arange(-.5, 1, 1), minor=True)
ax3.set_yticks(np.arange(-.5, 3, 1), minor=True)
ax3.grid(which='minor', color='black', linewidth=2)
return
def frame_plot(self, i): # Frame update at each stable increment
IP_idx = 0
dr = self.mainArray[i].data['DR'][IP_idx].value.T
tau = self.mainArray[i].data['TAU'][IP_idx].value
gip = self.mainArray[i].data['GIP'][IP_idx].value
time = self.mainArray[i].step_time
self.fig.suptitle('Step Time = {}'.format(time), fontsize=26)
self.im1.set_data(dr)
self.im2.set_data(tau)
self.im3.set_data(gip)
return
test = frame_iterator(entries, 'h_u=8')
test.animate()
plt.close()
display.Video("h_u=8.mp4")
[3]:
Or plot individual frames from required increments
[5]:
test.setup_frame()
test.frame_plot(0)
plt.show()